
Your cloud bill arrives. Total Azure spend is up 12% month-over-month.
Nothing alarming. Traffic grew. A few new features shipped. The budget threshold hasn't been breached, so nobody investigates.
What the account-level alert didn't tell you is that Azure Blob Storage was up more than 300% on its own. A misconfigured logging pipeline had been writing debug output to a storage account nobody was watching. It had been running for weeks.
This is one of the most common failure modes in cloud cost monitoring.
The problem isn't that alerts aren't firing.
It's that they're firing at the wrong granularity.
The problem with account-level thresholds
Most cloud cost alerting starts with a simple rule:
- Alert if spend exceeds $X
- Alert if spend grows more than Y%
- Alert if budget utilization reaches Z%
The problem is that these rules monitor a single aggregate number.
That number is the sum of dozens of services moving independently:
- Compute is flat
- Your database spend is down after a rightsizing effort
- Object storage is up sharply because an export job was left running
- CDN costs are growing normally with traffic
The total account spend might only increase by 8%.
Nothing triggers.
Meanwhile, one service is consuming significantly more money than expected.
The aggregate hides the anomaly.
This is why effective cost monitoring evaluates spend at the service level. Each service has its own usage patterns, growth trends, and operational risks. Treating them as a single number removes the very information you need to detect problems early.
What robust statistical detection looks like
The question worth asking isn't:
Is the account spending more money?
It's:
Is this service behaving differently from its normal historical pattern?
A common approach is to use a standard Z-score calculation based on the mean and standard deviation of recent spend.
That works reasonably well in controlled examples. Real billing data is usually messier.
Cloud spend contains seasonal behavior, gradual growth, occasional spikes, and one-off operational events. A single unusually expensive day can inflate both the mean and the standard deviation enough that subsequent anomalies appear normal.
The baseline becomes distorted by the very events you're trying to detect.
A more robust approach uses the median and Median Absolute Deviation (MAD) instead.
Because the median is resistant to outliers, a single extreme day has little influence on the baseline. The result is a model that reflects typical service behavior rather than being pulled around by unusual events.
The practical effect is straightforward:
- A service that normally costs $50/day and suddenly costs $200/day is detected immediately
- A service experiencing steady, expected growth doesn't generate unnecessary alerts
- Previous anomalies don't significantly weaken future detection
The value isn't simply using MAD. The value comes from applying robust statistical techniques to billing data that frequently breaks naive assumptions.
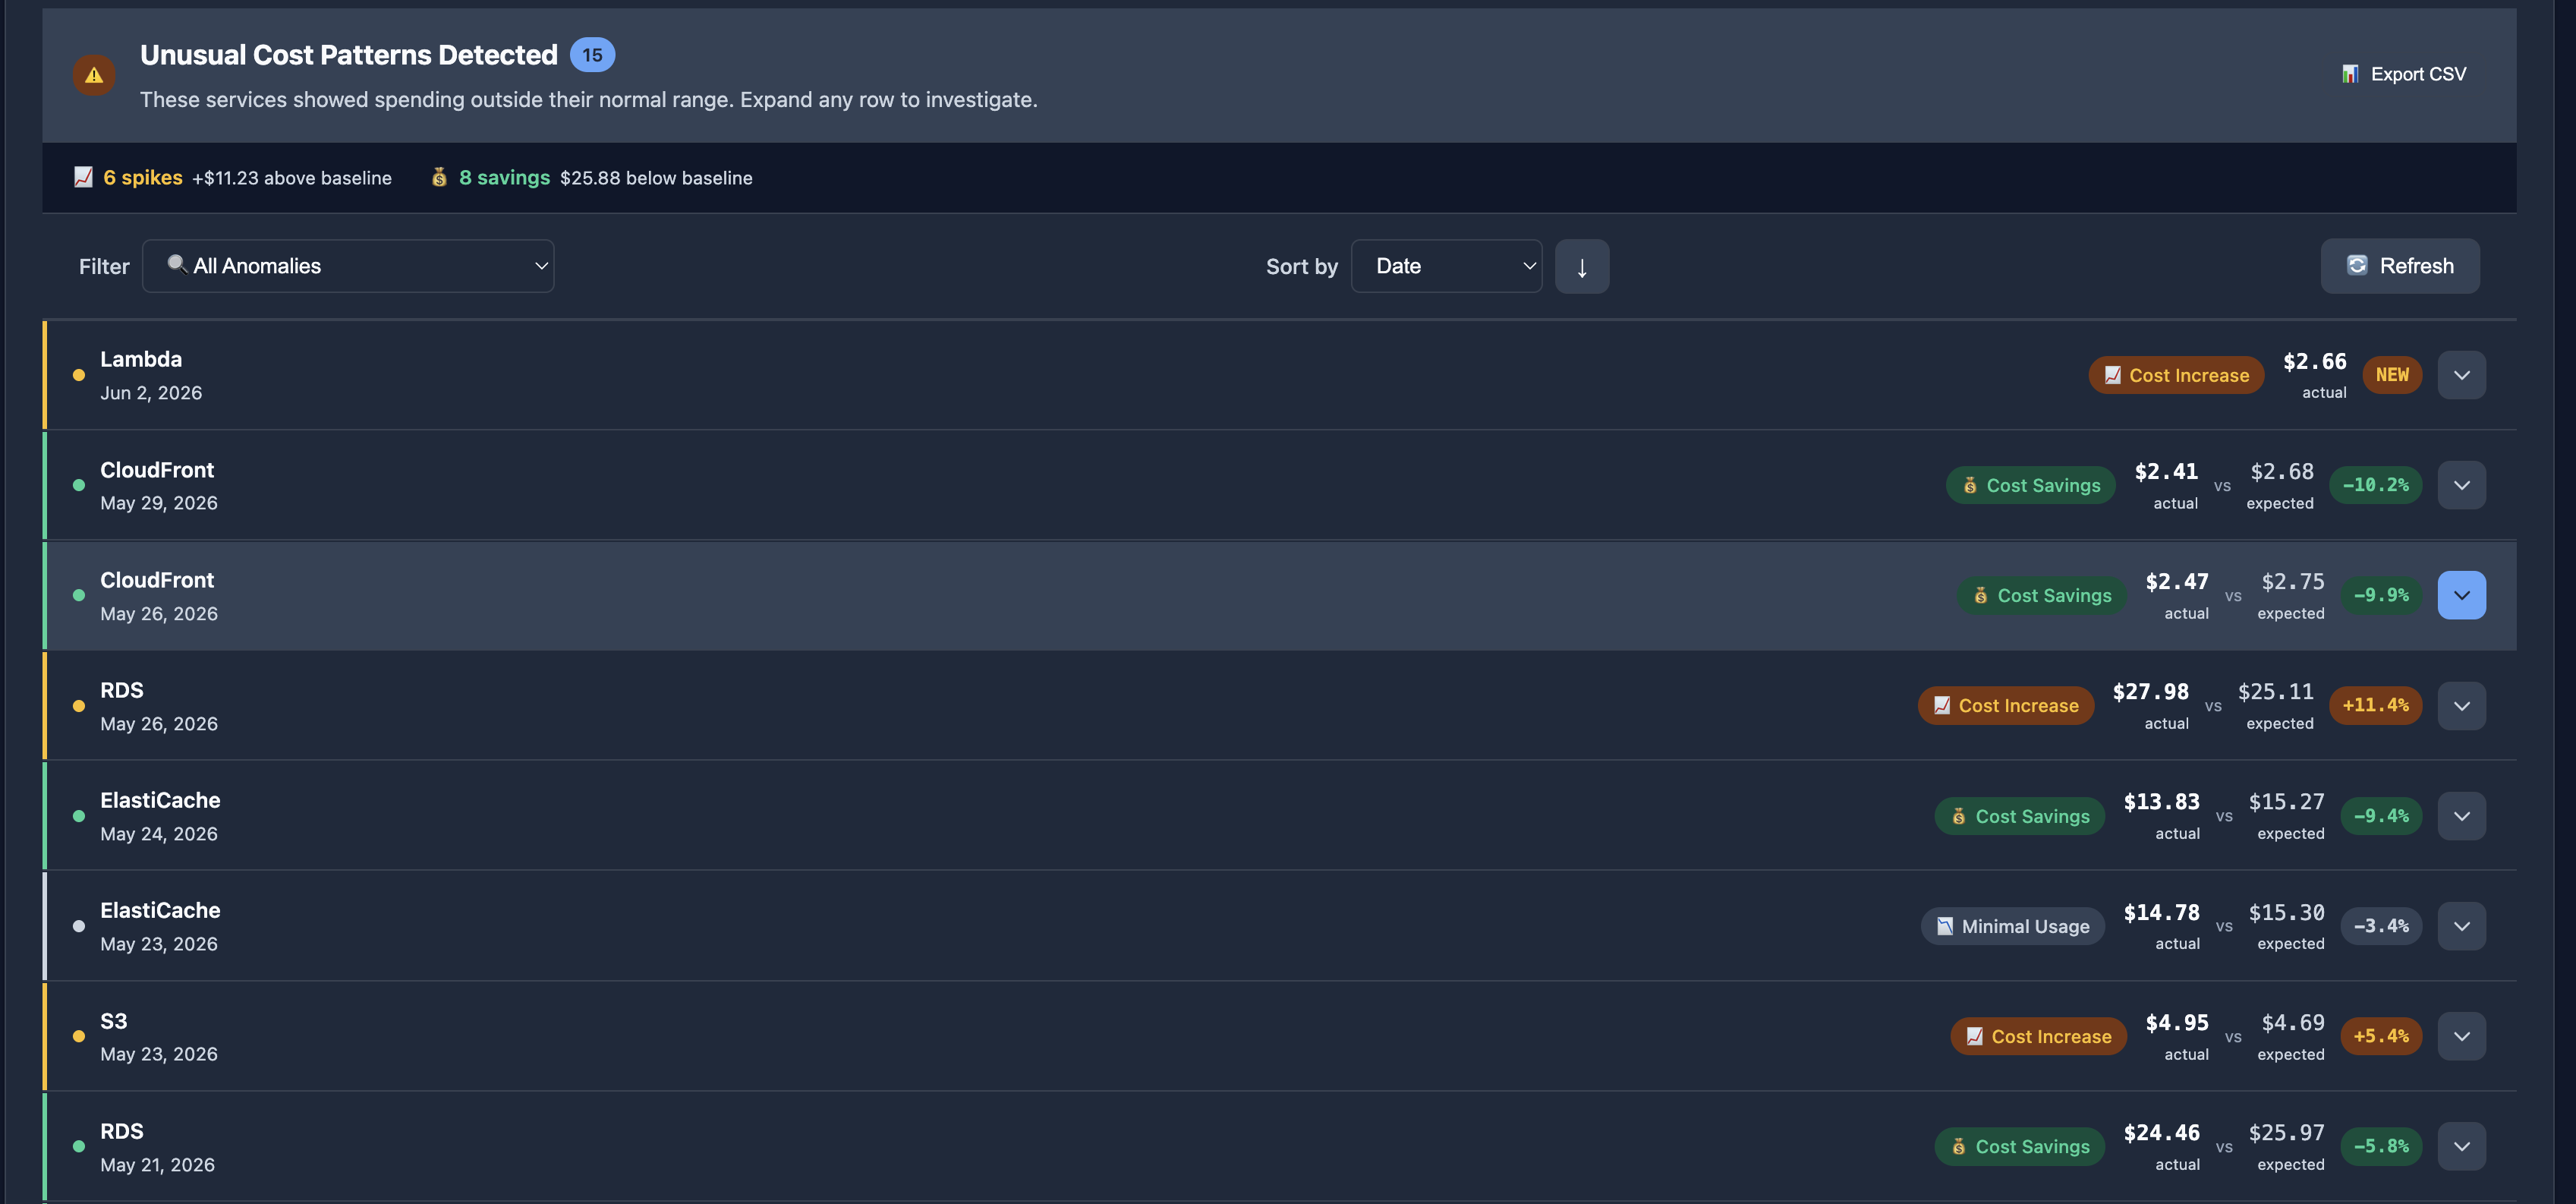
Each anomaly should provide enough context to act immediately:
- Service name
- Cloud provider
- Account identifier
- Anomaly date
- Actual spend
- Expected spend
- Deviation percentage
- Statistical score
- Severity level
The goal is to move from:
Your bill increased.
to:
Azure Blob Storage spent $340 yesterday against an expected baseline of $210.
That's an investigation starting point, not just a notification.
The edge cases that separate signal from noise
Most false positives come from a handful of situations that require deliberate handling.
Services with limited history
A service that has only existed for a few days doesn't have enough historical data to establish a reliable baseline.
A good detector acknowledges this uncertainty rather than pretending confidence exists.
When baseline confidence is low, alerts should communicate that explicitly so teams understand they may be observing normal startup behavior rather than a genuine anomaly.
The zero-to-something jump
A service that was effectively costing $0 and now costs $75 should not be reported as a 75,000% increase.
That percentage is mathematically correct and operationally useless.
The subtler problem is that many services never truly cost zero. Tiny charges from free-tier overages, rounding behavior, or low-volume activity can create baselines measured in fractions of a cent.
Treating those values as meaningful baselines often produces absurd deviation percentages.
Detection systems need to recognize near-zero baselines and classify genuine first appearances appropriately instead of reporting misleading multipliers.
Perfectly flat services
Some services have remarkably consistent daily costs.
In those situations, statistical variance approaches zero.
A strict Z-score implementation would classify even tiny changes as extreme.
Practical detection systems account for this by introducing proportional thresholds when variance becomes negligible. A rounding difference remains quiet, while a meaningful step change still triggers an alert.
These edge cases aren't unusual.
They're where most noisy alerting systems fail.
Detection is only half the problem
An anomaly that fires and is ignored is often worse than no anomaly at all.
Over time, teams stop paying attention.
For that reason, anomalies should move through a defined lifecycle:
| Status | Meaning |
|---|---|
new |
Newly detected and awaiting review |
acknowledged |
Someone has reviewed the anomaly |
investigating |
Active root-cause analysis is underway |
resolved |
Cause identified and addressed |
false_positive |
Confirmed as legitimate business activity |
Without workflow, alerts accumulate faster than they can be reviewed.
Eventually, teams return to discovering cost issues when the monthly invoice arrives.
Getting to root cause faster
Knowing that a service spiked is useful.
Knowing why it spiked is what creates value.
A practical approach breaks investigation into two phases.
The first phase is deterministic. Identify which resources changed on the anomaly date, rank them by cost impact, and classify the type of change — new resource, scaled up, scaled down, or removed. This step requires statistics and billing data, not AI.
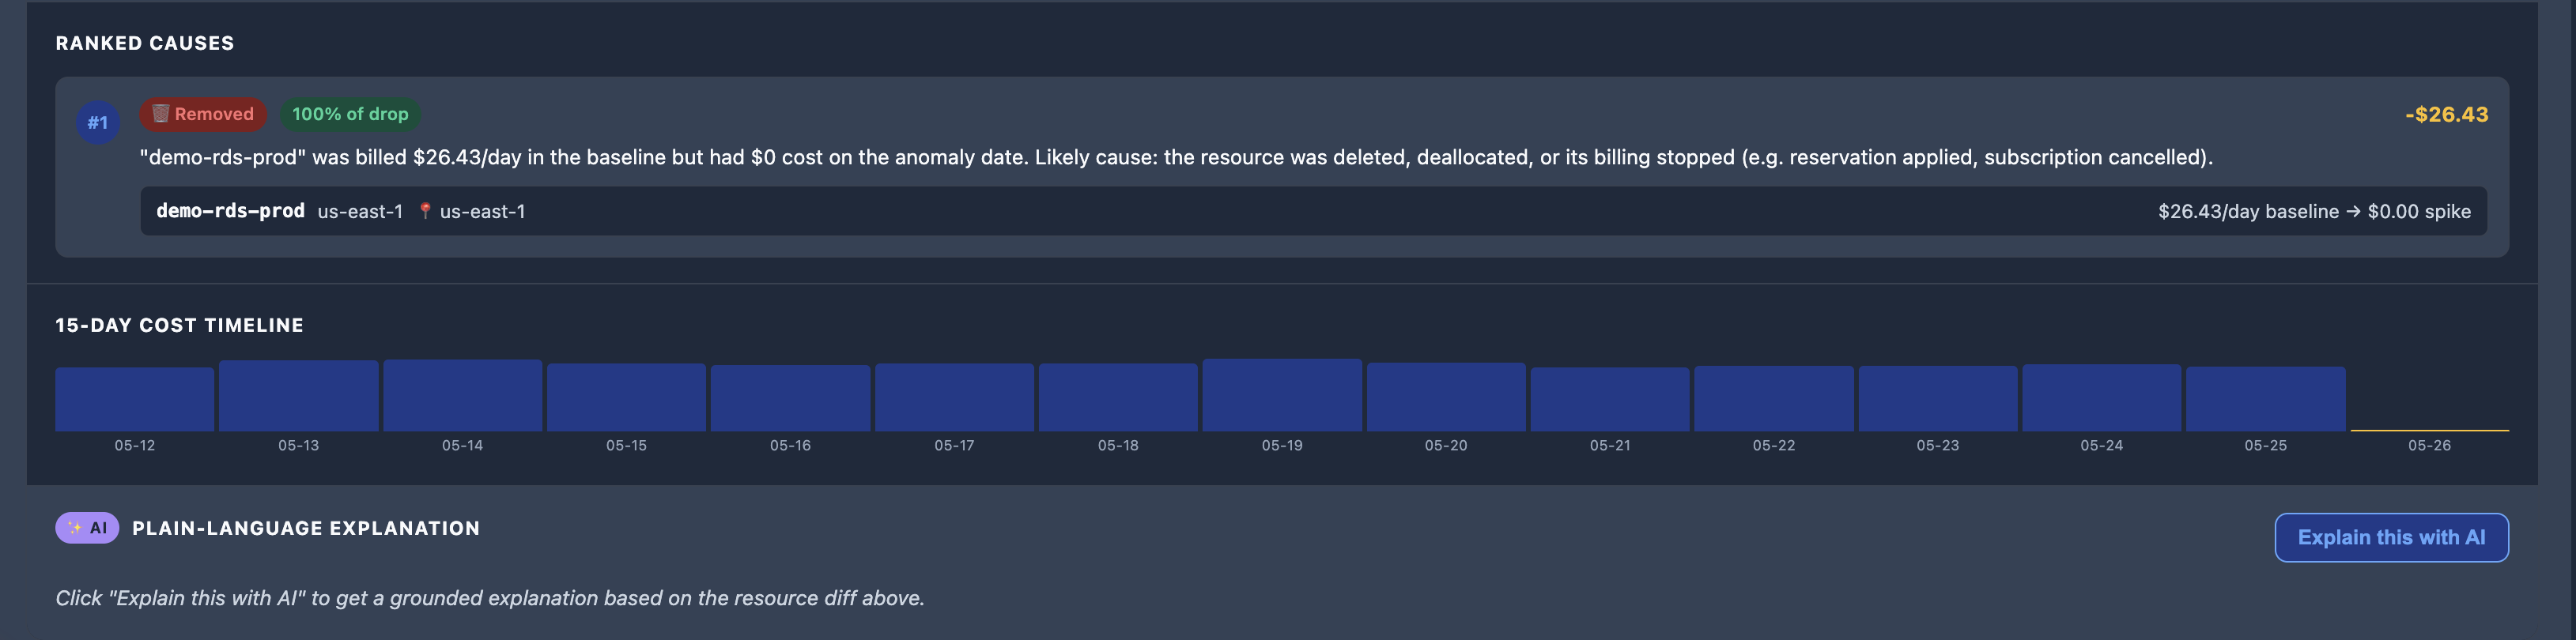
The second phase is explanatory. Given those resource-level changes, generate a concise explanation of what likely happened and where an engineer should investigate first.
This is where language models can be genuinely helpful. Not for detecting anomalies, but for translating structured findings into human-readable explanations.
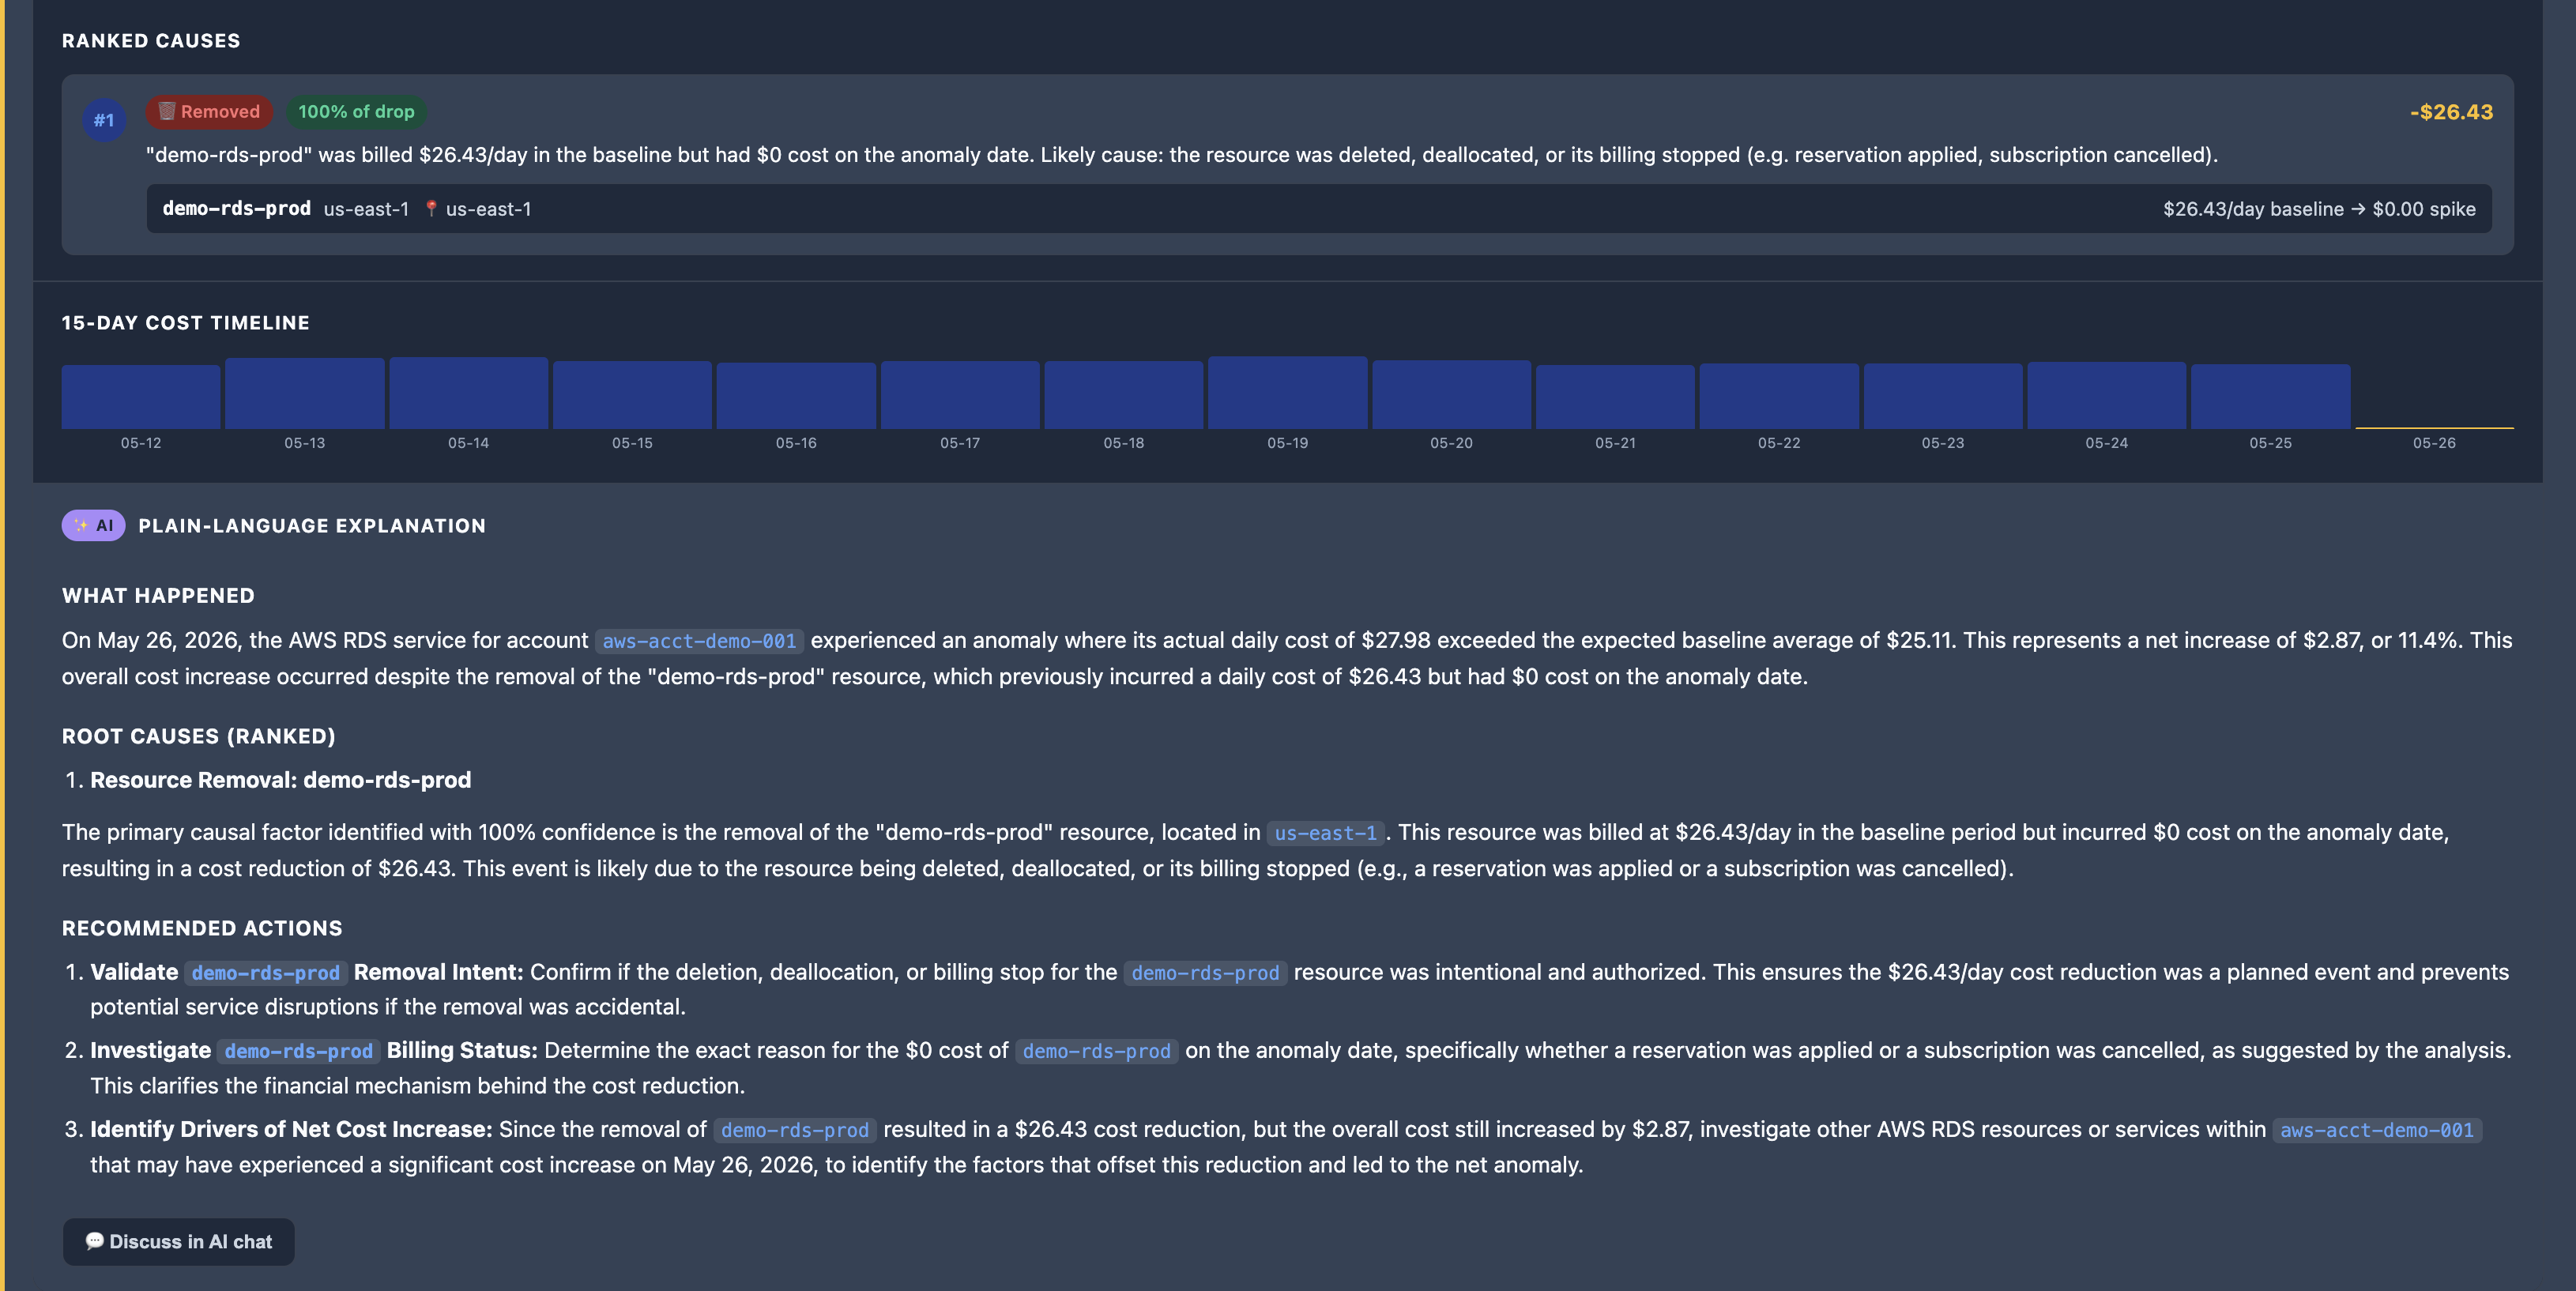
The combination moves teams from:
Object storage spiked.
to:
A specific storage account experienced an unexpected increase in write operations beginning on June 3rd, accounting for most of the service-level cost increase.
That's a much shorter path to resolution.
Routing alerts where teams already work
Even accurate detection is ineffective if nobody sees the result.
Alerts should arrive where teams already spend their time:
- Slack
- Microsoft Teams
- Discord
- Custom webhooks
- Incident management platforms
A useful webhook payload contains enough information to understand the issue without opening another dashboard:
{
  "event": "anomaly.detected",
  "data": {
    "service_name": "Amazon EC2",
    "account": "123456789012",
    "provider": "aws",
    "date": "2026-06-03",
    "actual_cost": 340.50,
    "expected_cost": 210.00,
    "deviation_percent": 62.1,
    "severity": "high"
  }
}
The recipient should immediately understand:
- What changed
- Where it changed
- How significant the change is
- Whether action is required
The gap most teams are living with
Most engineering teams already have budget alerts.
Those alerts typically fire late and provide little guidance beyond "spend increased."
That's useful for reporting.
It's much less useful for operational cost control.
Service-level anomaly detection, combined with robust statistical baselines and a structured investigation workflow, changes the question from:
Why is our bill high?
to:
Which service changed, when did it change, and what caused it?
That's the difference between monitoring cloud spend and actively managing it.
If you're only watching account totals, you're seeing the outcome.
You're not seeing the cause.
CostOptix detects service-level cloud cost anomalies across Azure, AWS, and Google Cloud using robust statistical methods, with alert delivery through Slack, Microsoft Teams, Discord, and custom webhooks. Start free, no credit card required →